How to configure utilisation reports
This guide is an introduction to the utilisation concepts and a walk through of how to configure the report

Understanding the components of Reporting
Our reporting tool is built around two key concepts: templates and target objects.
- A template defines what you want to measure and has predefined data transformation, configuration and calculations.
- A target object defines where to apply that template, e.g for room, equipment or staff
By separating these two, you can reuse the same template across different scenarios, compare results, and get consistent insights without rebuilding your reports from scratch.
Introducing the utilisation concepts
In this guide we will deep dive into the first reporting template "utilisation". There are three predefined metrics in the utilisation report which are defined as follows.

1. Frequency
This represents how a resource is being used over a given period. It is expressed as the number of times the room is booked compared to its availability. In the above example, the room is used 5 hours out of the possible 9 hours it is available, the frequency rate is 55.5%.
Hours Used/Hours Available = Frequency
2. Occupancy
This represents how well a resource is used, when it is used. In the above example, in the 5 hours that the room is used, there are different amounts of students in the room at different times, the Occupancy is 62.6%
Number of students/Room Capacity
3. Utilisation
This is a broader measure that combines both the frequency and occupancy rates. It assesses how effectively a room is used, considering both how often and how fully it is used when it is in use. Utilisation analysis helps identify opportunities to optimise the use of space.
Utilisation = Frequency x Occupancy
How to configure the utilisation reports
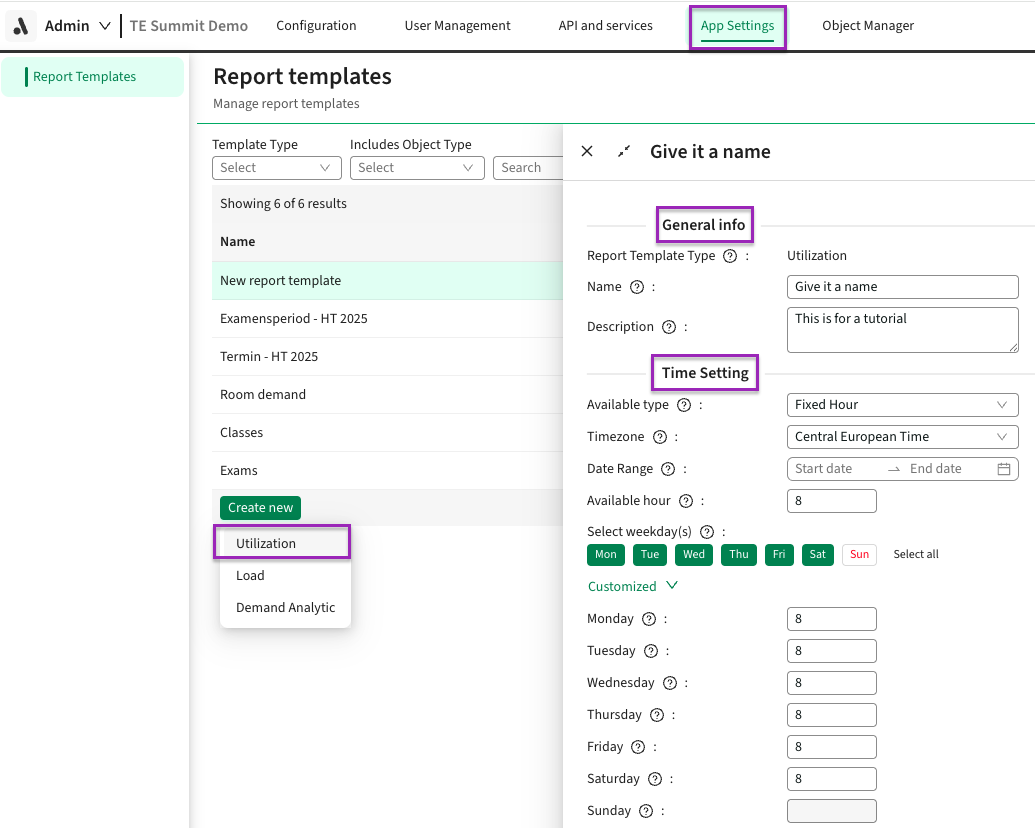
To configure your utilisation report, go to Admin -> App settings -> Reporting.
- Start by clicking the "Create new" button in the table
- Select what template to use, in this case: Utilisation
- General info: Give the report a meaningful name and description in the general info, this name will be displayed in the Reporting interface later on.
- Time settings: There are three options for available type:
- Fixed hours: Define a standard set of “opening hours” that apply every day (e.g. 08:00–17:00). These hours are used as the denominator in the calculation, which means utilization can exceed 100% if bookings happen outside the defined window. Use this option when you want a consistent availability baseline across all days.
- Time range: Set a start and end time for each day (e.g. Monday 09:00–15:00, Tuesday 10:00–18:00). Reservations outside these windows won’t be counted, and the denominator will be the number of hours in the range. This option is useful when availability should reflect real operating hours that vary by day.
- Max hours: Instead of defining hours manually, pull the maximum available hours directly from your data model. Each resource (e.g. a room) can have its own max hours field, and this value is used as the denominator. Best when different resources have different contractual or defined limits (like a lab capped at 20 hours/week vs. a lecture hall at 40).
- Timezone: The timezone being used for the report. This will mean all reservations will be considered in the selected timezone
- Date Range: The date range that will be taken into account when finding reservations for this report
- Available hours (Fixed hours): The available hours are treated as the denominator - this means utilisation can be over 100%.
- Default time range (Time range): The default time range to look at per day, e.g opening hours from 08:00 am to 17:00 pm
- Select weekday: If you need to configure the report to only look at reservation from certain days, you can select the weekdays
- Customised: If you want to have custom available hours or time range for each day, press the customised button and input the values for each day of the week
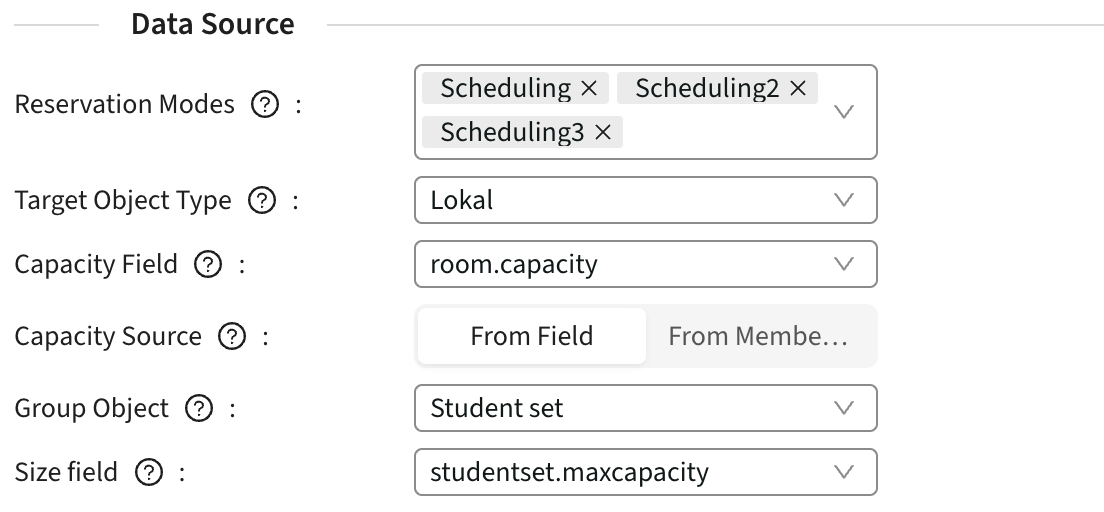
Data Source Settings
- Reservation modes : Select the reservation modes from which you want to retrieve reservations to include in the report calculations.
Example: You may want to distinguish between times when rooms are actually in use versus when they are blocked for other reasons, such as maintenance. These types of block reservations should typically be excluded from the calculations, ensuring that only reservations involving students or staff are counted. - Target Object Type: Select the Object Type, you want to retrieve reservations for with the selected object type. For example, selecting Room will find any reservations that have a room object on it
- Capacity Field: This is used for the occupancy calculation. Choose a integer field that holds the capacity of the target object type e.g. Room Capacity. This is the denominator used in the occupancy calculation
- Capacity Source: Choose whether the capacity source for the numerator should be from a Field on an Object or from the membership of the object
- Group Object: Choose the object used for the Capacity Source
- Size field: If From Field is chosen for the Capacity Source, then you need to designate a field that holds the number used for the occupancy calculation (Numerator)
Thresholds
- Thresholds will dictate the colouring in the report for the customer under “Utilisation”. Anything lower than the Low threshold or higher than the high threshold, will be red.
.png)
.png)
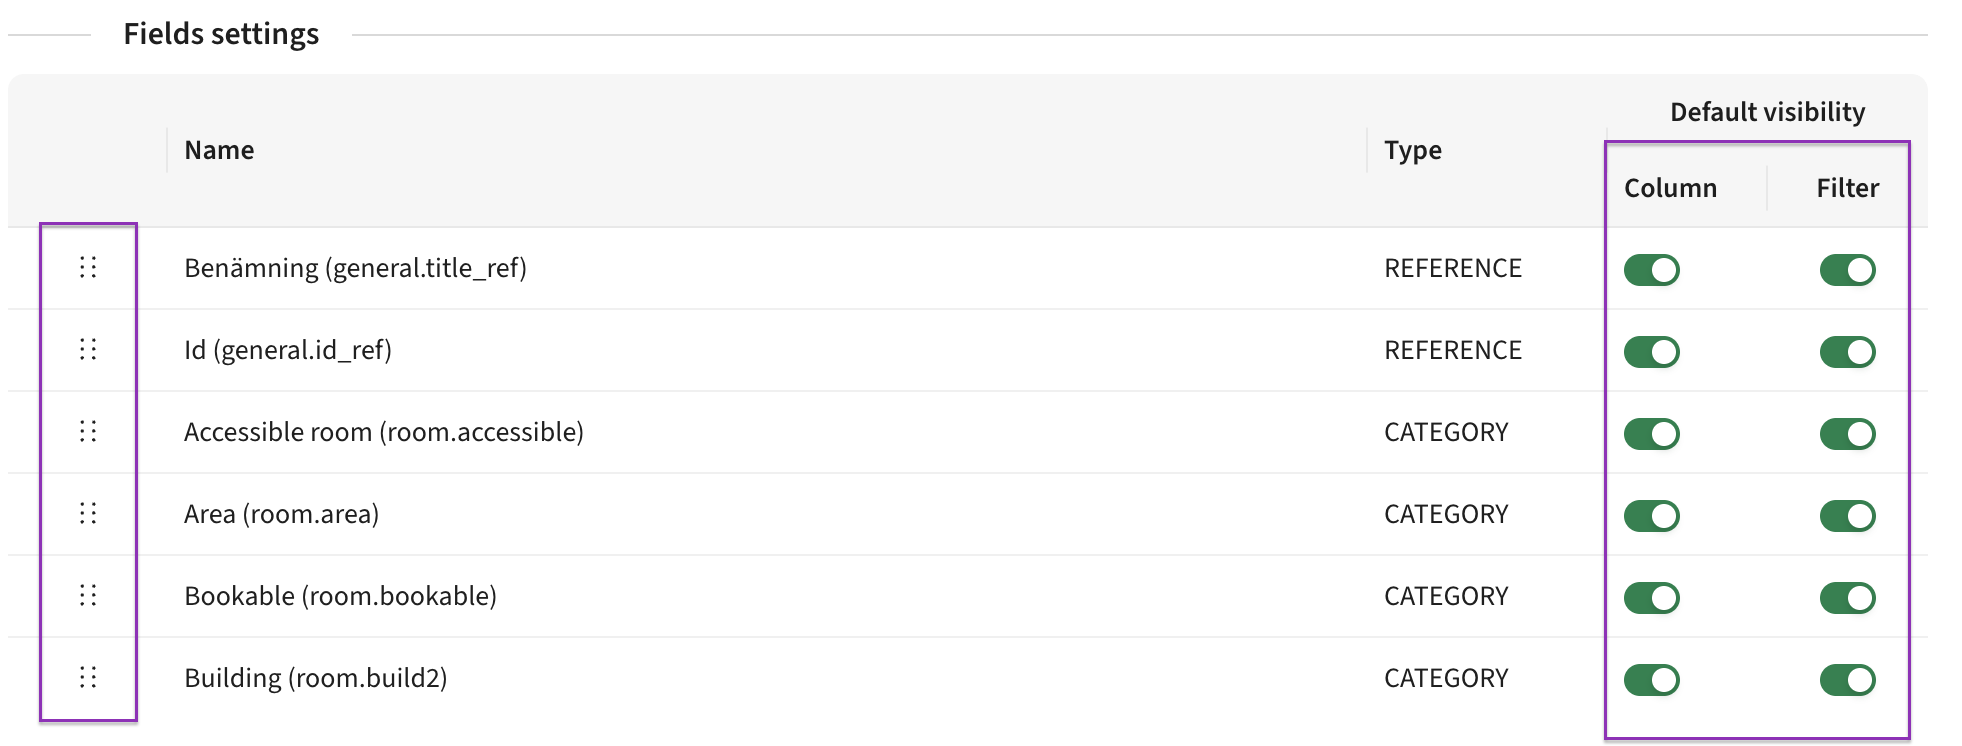
Field Settings
- Field settings can be configured which will be a applied for this specific report in the reporting interface
- Column: This will control if the field is visible in the report table
- Filter: This will control what fields are available to filter the data on in the report table
- Rearranging column order can be done using the handles on the left of the fields and will dictate the column order in the report.
That’s it - your utilisation report is ready to go! With the right template, settings, and thresholds in place, you’ll now be able to see not just when resources are used, but how well they’re being used. The more consistent your setup, the easier it becomes to spot trends, compare spaces, and make smarter decisions about your resources.